Finland, much like the other Nordic countries, has some of the highest income tax rates in the world. The taxation is progressive, the more you earn higher the tax rate, and helps fund social services (education, healthcare, etc.) and welfare programs (pension, unemployment allowance, etc.) among other things (infrastructure, salaries of politicians?).
Anyway, have you ever wondered how taxes actually look like in real life on real paychecks? I’ll provide a detailed breakdown here on my own salary slips.
To make this a bit more interesting, I will demonstrate how taxes are levied in two scenarios, one where I made about 50K USD annually in 2020 and another where I made over 100K USD a year in 2025.
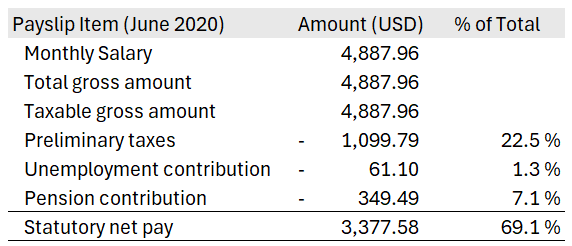
Let’s look at the numbers in the first case. Note that I have converted euro amounts to US dollars with the same FX rate for both the scenarios outlined below.
Statutory net pay is the amount I received in my bank, so I got about 69% of my stated salary in my account whereas 31% of my salary went to the state in various forms of taxes. While it can be argued that I may see the pension contribution paid back to me by the state some day in the future, it is safe to assume it is lost money for now.
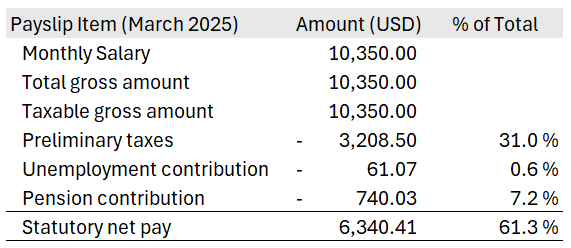
Now the second scenario with over 100K per year salary in 2025. Here, I got only 61% of my stated salary transferred to my bank account whereas 39% went away in taxes. That is a massive contribution towards keeping the country running.
It’s interesting to note that the pension contribution as percentage of the salary did not change meaningfully in the two scenarios, whereas unemployment contribution remained approximately the same in terms of dollar amount.
So there you have it – real Nordic taxes on real paychecks. In case you are curious, all payroll taxes in Finland are automatically deducted by the employer based on a pre-defined, self-declared level of annual income at the start of the year to the tax office, which then issues a tax card outlining the tax rates.
A Wise account has enabled me to receive withdrawals from IBKR on the same day. Very handy indeed.
As I end up dealing with multiple currencies (mainly EUR, CAD, SEK, AED, INR), having a Wise account has become a life saver. Initially, of course there was reluctance in terms of trust & reliability, however, after starting with a few transfers of small amounts (few hundreds/thousands of dollars) to moving tens of thousands of dollars – Wise feels just like a bank, in fact a much faster, more modern bank. And yes, while Wise is regulated and all, building trust with money does take time.
Disclaimer: This is not a paid/sponsored post. I am sharing my own experience of using Wise.
The real game changer was when Wise and IBKR got together, enabling deposits and withdrawals. I recently tested a SEPA (EUR) withdrawal from IBKR to my Wise account and received the money within a few hours on the same day.
I also use digital debit cards available in the Wise app on my phone, so overall this whole setup is very neat.
Let’s look at how to make this work, assuming you already have a Wise account.
Log in to your IBKR client portal via their website:
Enter your credentials and approve via 2 step authentication.
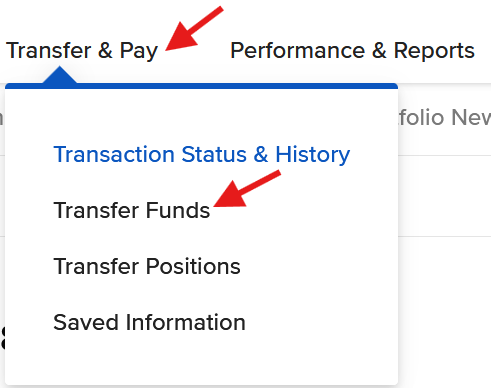
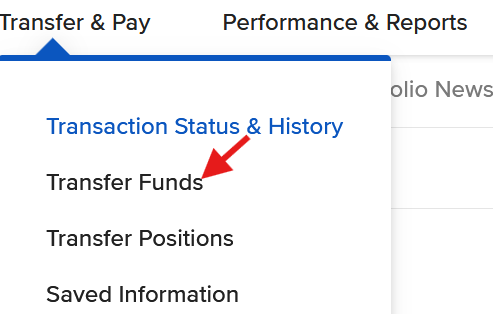
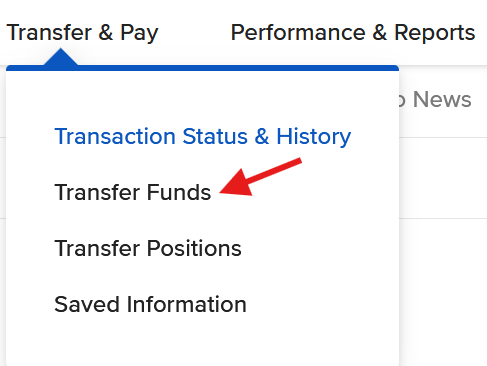
Click Transfer & Pay, then click Transfer Funds.
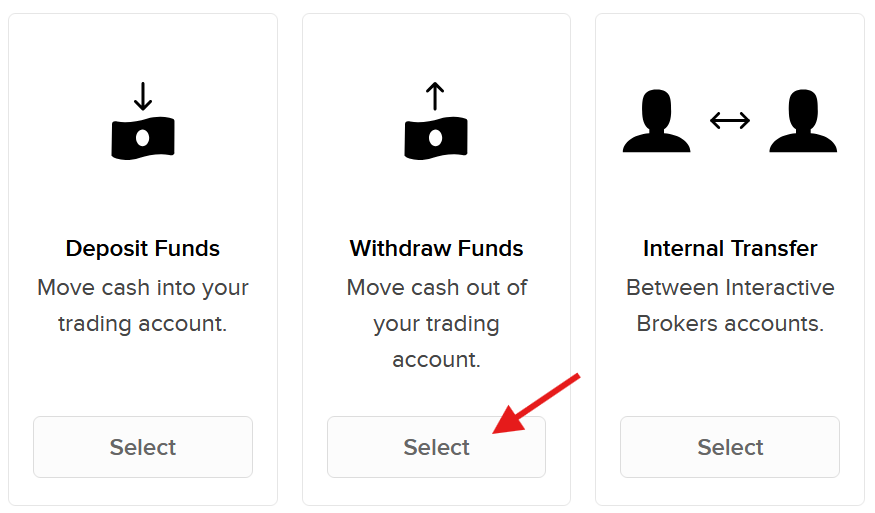
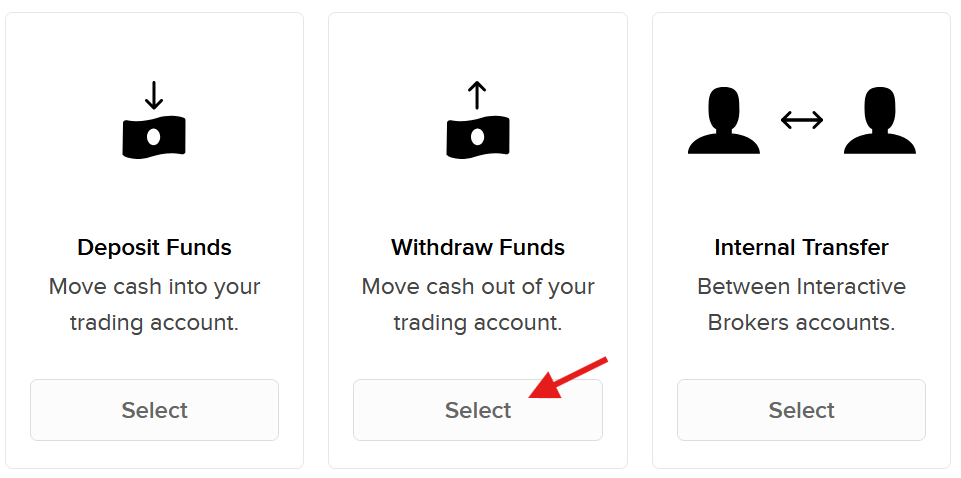
Click Select under Withdraw Funds.
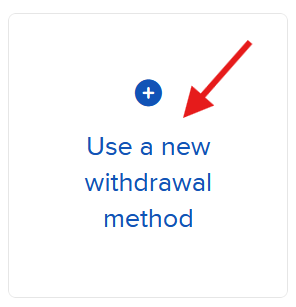
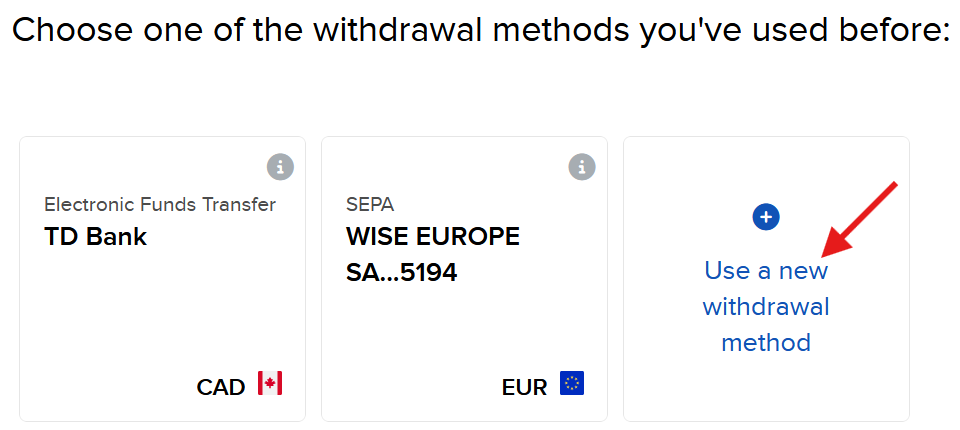
On the next screen, click Use a new withdrawal method.
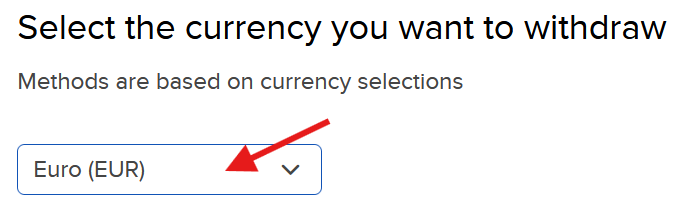
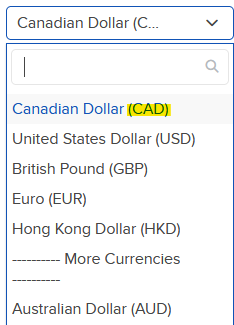
Choose EUR from the drop-down menu.
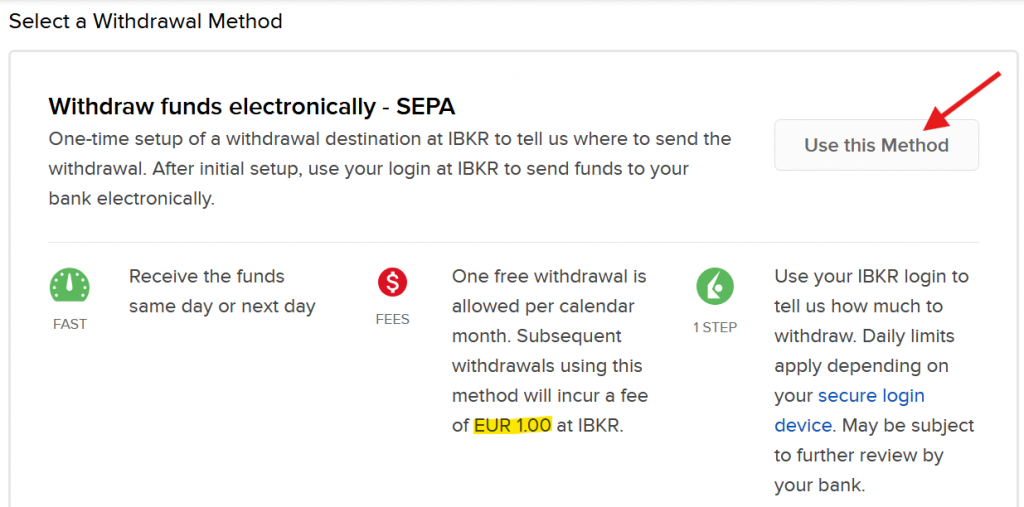
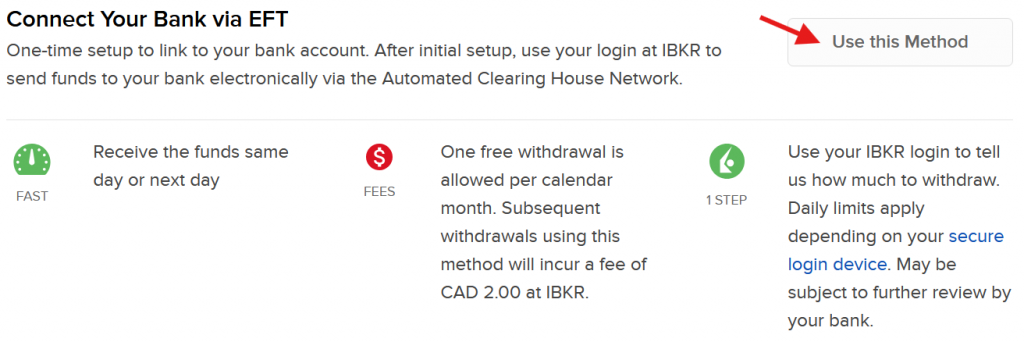
Click Use this Method. Note that first withdrawal per month is free of charge and subsequent withdrawals will cost EUR 1 each.
SEPA/Euro withdrawals are currently the cheapest in terms of subsequent withdrawals, i.e. if you plan to withdraw money multiple times a month, then EUR currency withdrawals are the most cost efficient (1 EUR) compared to other currencies.
SEK withdrawals cost 50 SEK and USD withdrawals incur 10 USD after the first withdrawal of the month.
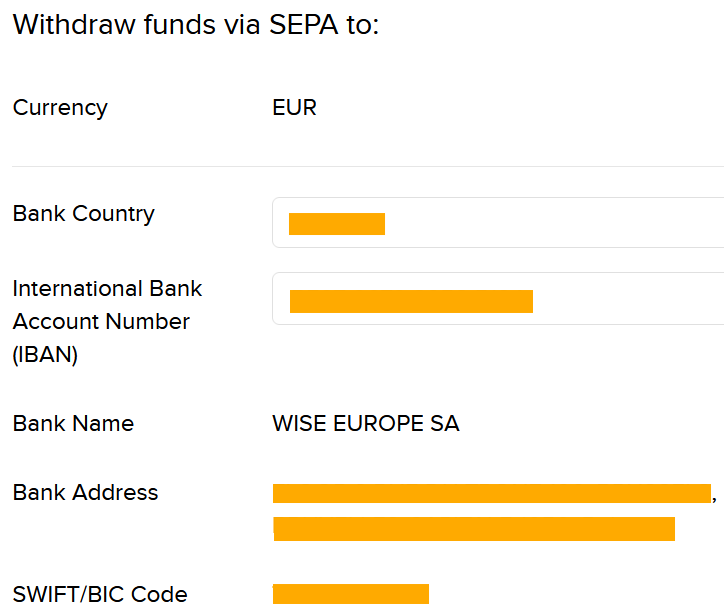
Fill out the details of your EUR Wise account (mainly bank country and IBAN). You can find the Wise bank account details in your Wise app/account. Once you plug in the details, IBKR will recognize the bank and display the complete address and SWIFT code and assign a nick name.
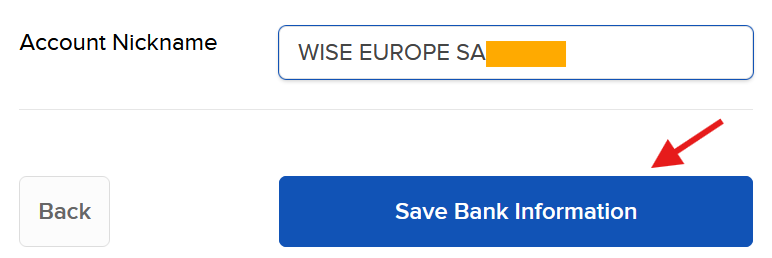
If everything checks out, click on Save Bank Information.
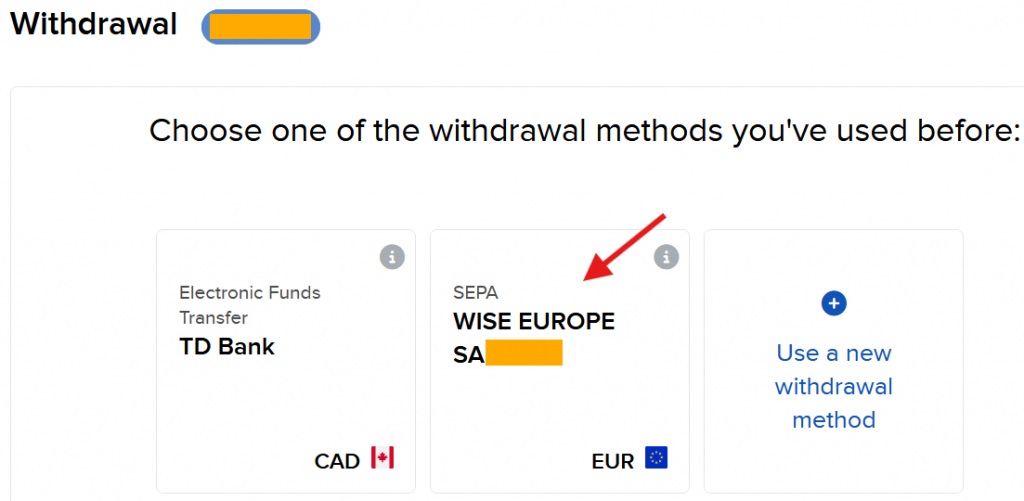
The new withdrawal method will be saved. Click on it to begin a withdrawal request.
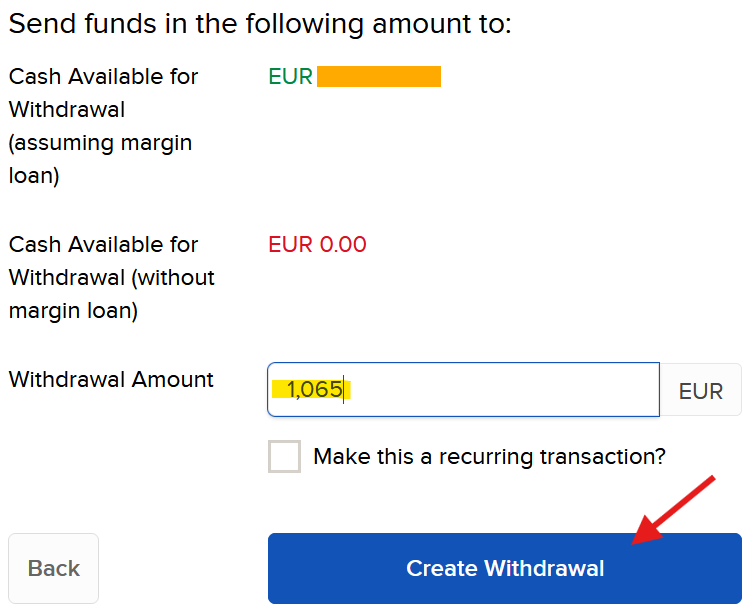
Fill in the amount you want to withdraw, in this case I made a request for EUR 1,065.
On the next screen after clicking on Create Withdrawal, you will be required to enter user credentials and approve via 2 step authentication to confirm the withdrawal request.
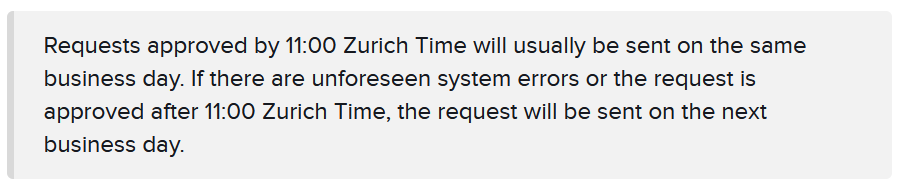
I initiated this request in the morning around 9am CET.
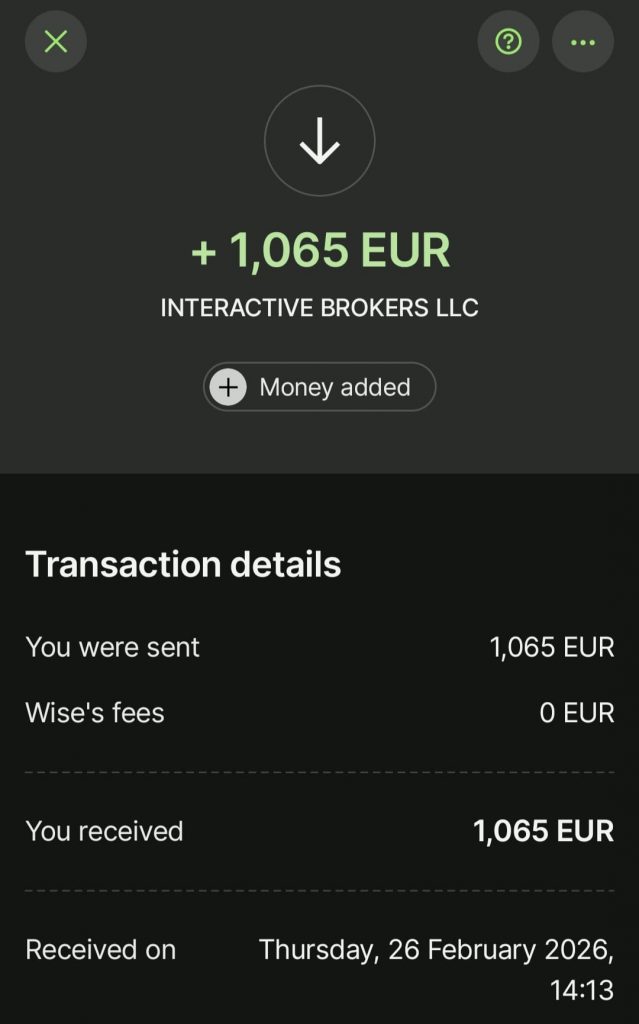
To my surprise, I got a notification on my phone from Wise in the afternoon (about 2pm CET) on the same day – the money has arrived and available for use.
Also, note the beauty of zero fees in Wise on incoming transactions.
Brilliant – well done Wise and IBKR for making money transfer so quick & smooth.
There are 3 components to the withdrawal process in IBKR:
Link your bank account (required only once)
Convert currency (only if withdrawal currency is different than the currency of cash held in your IBKR account)
Initiate withdrawal
To receive money from IBKR in your Wise account on the same day – see this article here (upcoming).
Part 1. Link your bank account
To withdraw funds from your Interactive Brokers (IBKR) account to your bank account, you need to first link & verify your bank account in the IBKR portal. Here’s how.
It is extremely important to ensure that the bank account is held in exactly the same name as the IBKR account. Otherwise the transfer will be rejected.
If IBKR is a joint account and the withdrawal is into a bank account held in the name of one of the joint account holders – that will work!
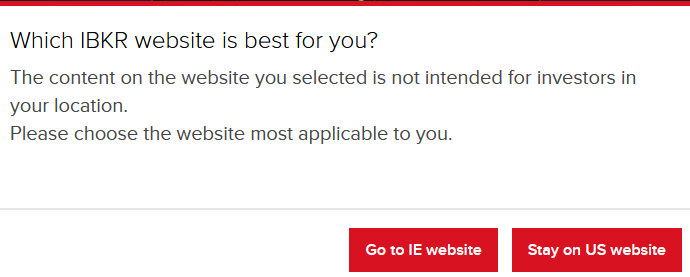
Note that depending on your region/location, IBKR will redirect you to their relevant website and you may see this pop-up. Select the option that is relevant to you.
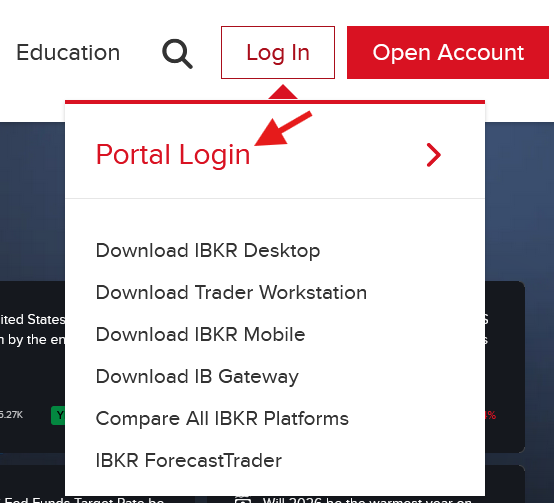
Click Log in (available in the top right corner) and click Portal Login.
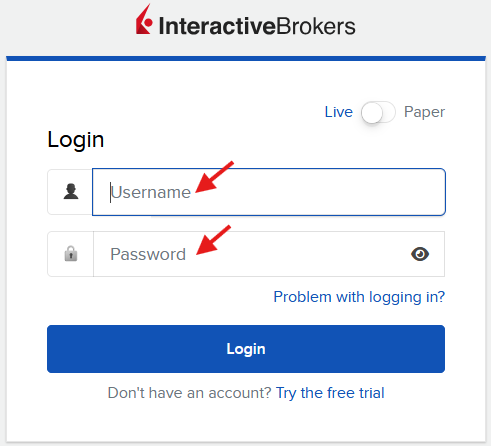
Enter your user credentials and approve via 2 step authentication.
Click Transfer & Pay
And click on Transfer Funds
Click on Select under Withdraw Funds
Click on Use a new withdrawal method.
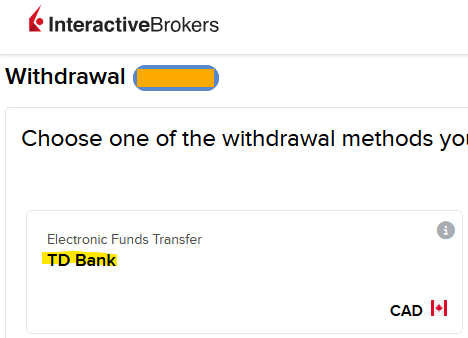
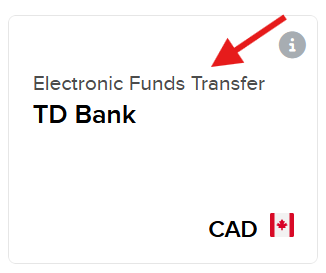
Note that if you have previously set up any withdrawal methods, those will be saved and appear here, e.g. I have linked TD Bank & Wise.
Depending on the currency you want to withdraw, there will be different withdrawal methods available.
For this article, I will use CAD.
To link your Canadian Bank account to IBKR, click on Use this Method under Connect Your Bank via EFT.
Remember one withdrawal is free per month and subsequent withdrawals will incur a $2 (CAD) charge (as of writing this post).
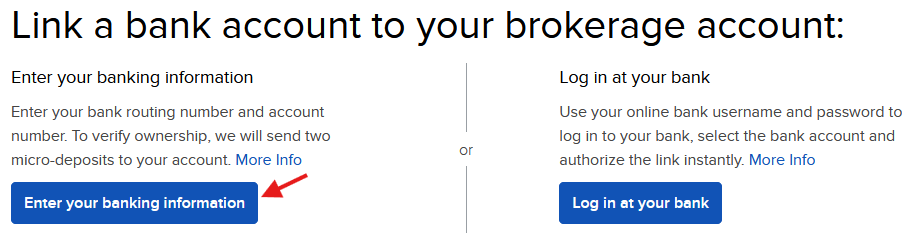
Choose the option to enter your banking information
Select Debit & Credit if you’d like to deposit & withdraw funds from this bank account, otherwise choose Credit – withdraw only.
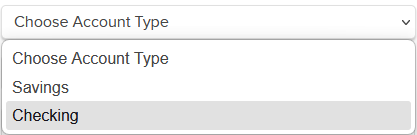
Next, choose whether your bank account type is checking or savings.
Then enter your bank account number and confirm it by re-entering the same.
Then click to locate your bank.
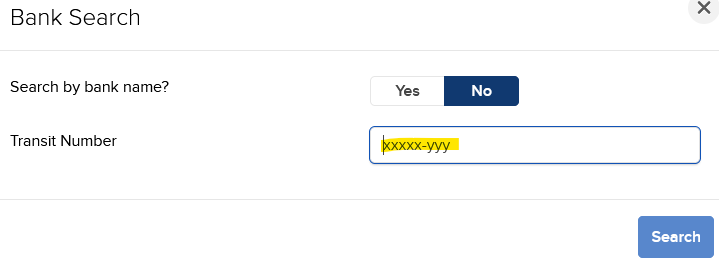
Enter your bank’s transit number and click search, note the format for Canadian Banks (xxxxx-yyy).
You can find the transit number in your web bank under cheque details of the account
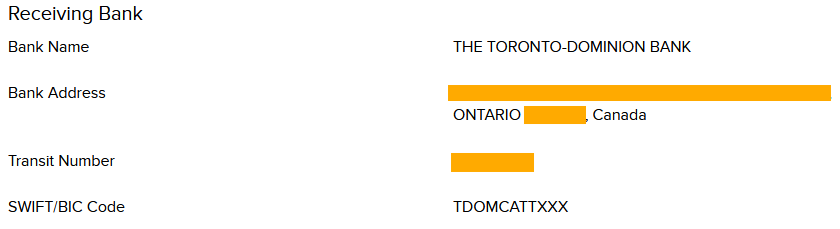
If you enter the transit number correctly, IBKR will find your exact bank branch and display the branch address.
Add an account nickname to identify & choose it easily later.
Finally, click on Save Bank Information.
On the Withdrawal screen the new method will appear with the Nickname you chose.
Nice! You have successfully setup your bank account for future withdrawals.
IBKR will soon initiate 2 micro deposits to verify your bank account. You will have to enter the micro amounts back in IBKR client portal to verify those amounts. Think of this as receiving a pin code to verify your phone number.
In my case, it took 2 full business days for the micro deposits to appear on my checking account. It looks like this in TD Bank:
Enter these amounts in IBKR client portal to verify and complete your account setup. You may enter the amounts in any order.
Now your bank account is fully linked, verified and all set to receive money from your IBKR account.
*
Part 2. Convert currency
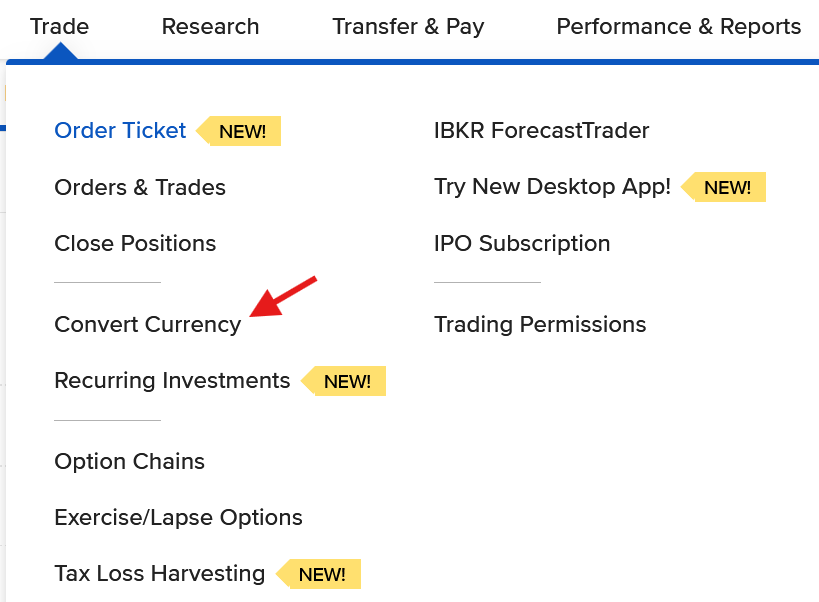
Login to IBKR client portal and click Trade
Click on convert currency
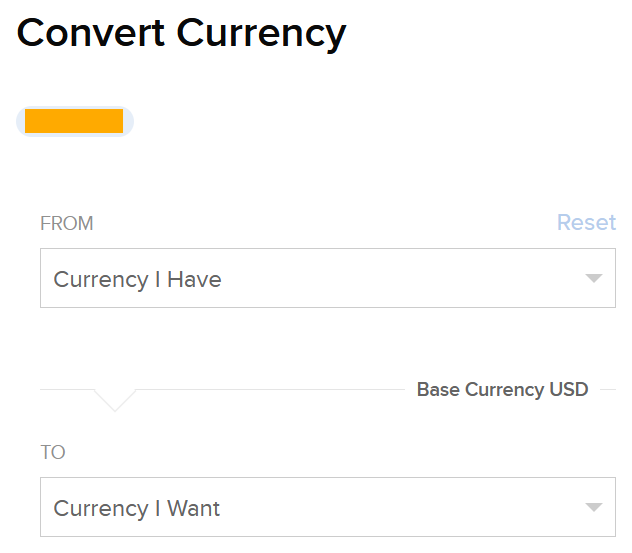
IBKR has recently made a user friendly interface to convert currency. Choose the currency in which you have cash readily available (FROM: Currency I have). Then select the currency you want after conversion (TO: Currency I want) – this is the currency you want to withdraw money to your bank account.
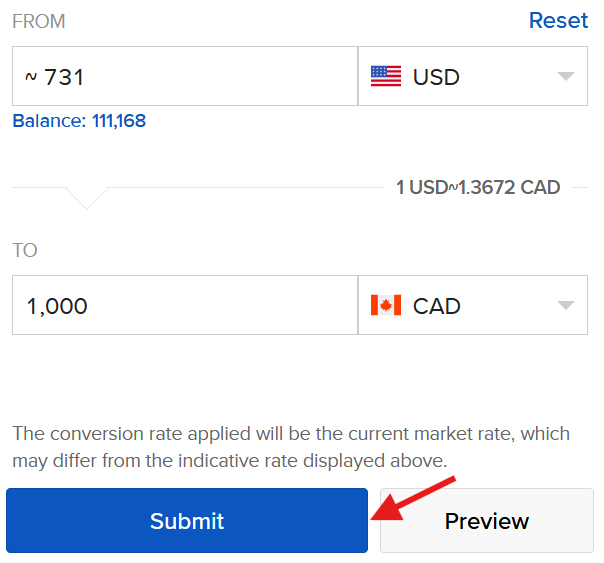
Fill the amount you want to convert or the amount you want to have in the end. For example, here I want to receive 1000 CAD and based on the current FX market rate, the corresponding USD amount is shown. Click submit to execute the FX trade. Generally this will be an odd lot order (you will get a pop-up to acknowledge that) and the trade will be executed immediately.
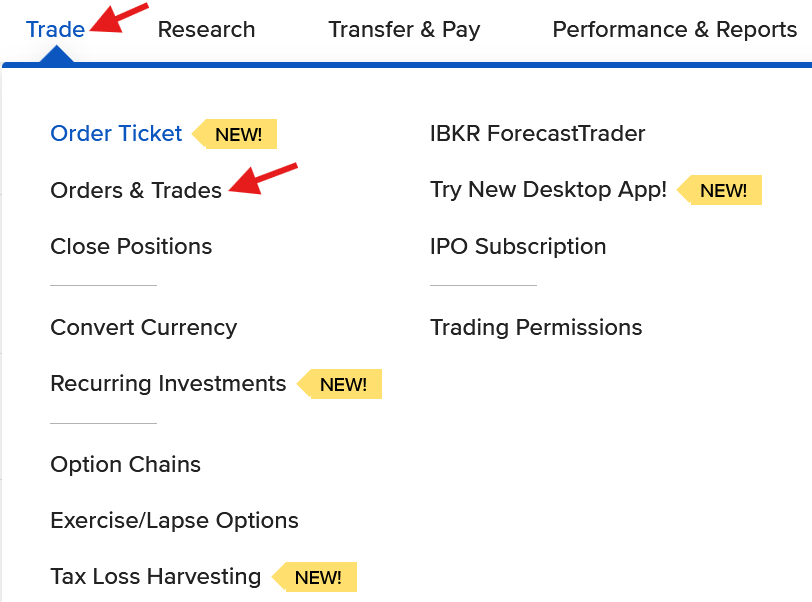
To view the transaction, click Trade and then click Orders & Trades.
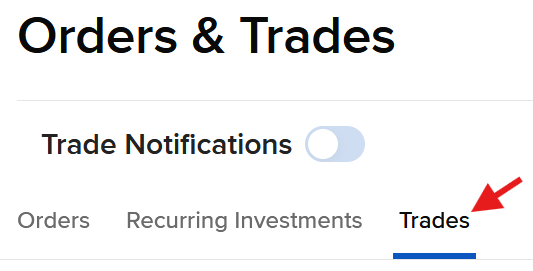
If the order was executed, it is visible under the Trades section. The commission/fee to execute this FX order was 2 USD.
*
Part 3. Initiate Withdrawal
Log-in to IBKR client portal, navigate to Transfer & Pay and click Transfer Funds.
Click Select under Withdraw Funds.
Choose the EFT method you just created in Part 1.
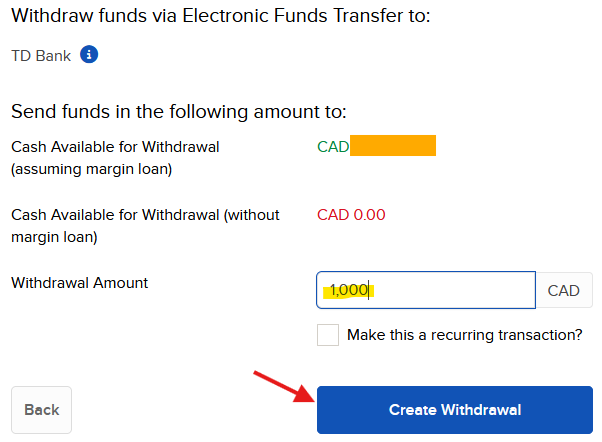
On the next screen, enter the amount in CAD you want to withdraw and click Create Withdrawal.
Important: If you have a margin account at IBKR, then you can initiate the withdrawal right after converting the currency – even if this screen shows CAD 0 available for withdrawal. Otherwise you need to wait T+2 days for currency settlement before withdrawal.
You need to enter your user credentials on the next screen and approve the withdrawal via 2 step authentication.
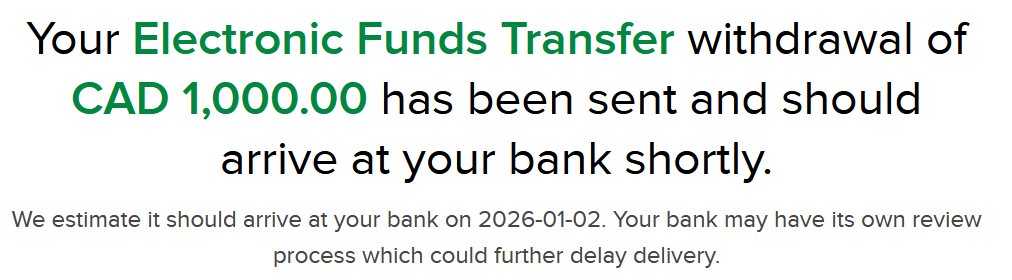
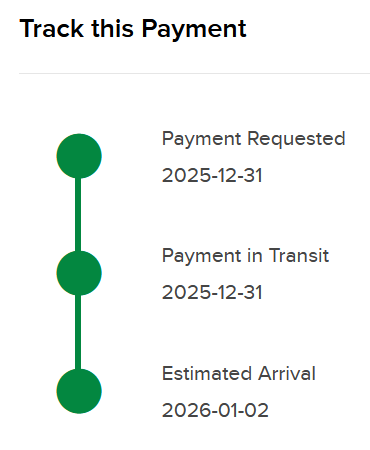
After that, you should see a confirmation screen like the one below.
And indeed, on Jan 2, 2026, I received $1000 CAD in my TD Bank.