I suspect the market will likely take out traders on both sides, with higher volatility months ahead (July to October) there is a probably a good chance of a large drawdown and then a rally. Hope this provides solid trading opportunities.
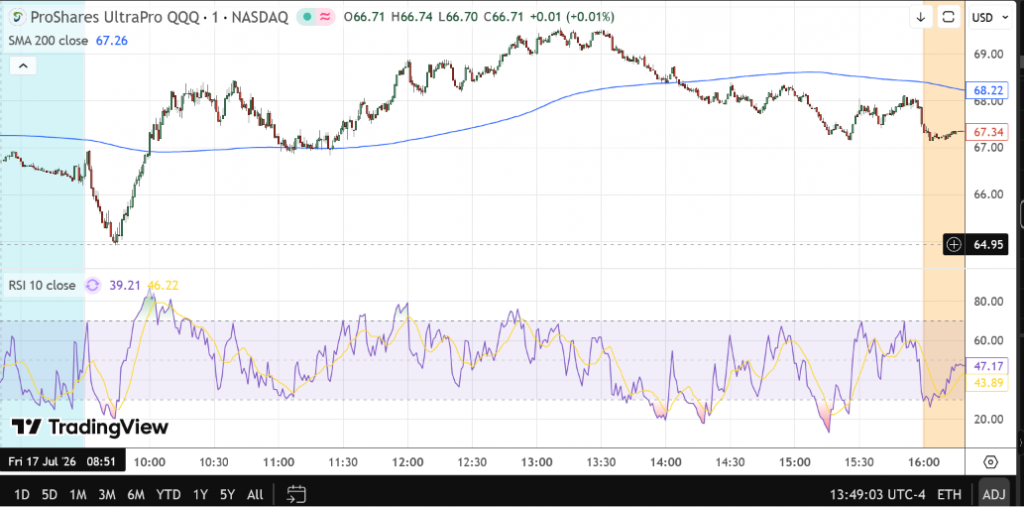
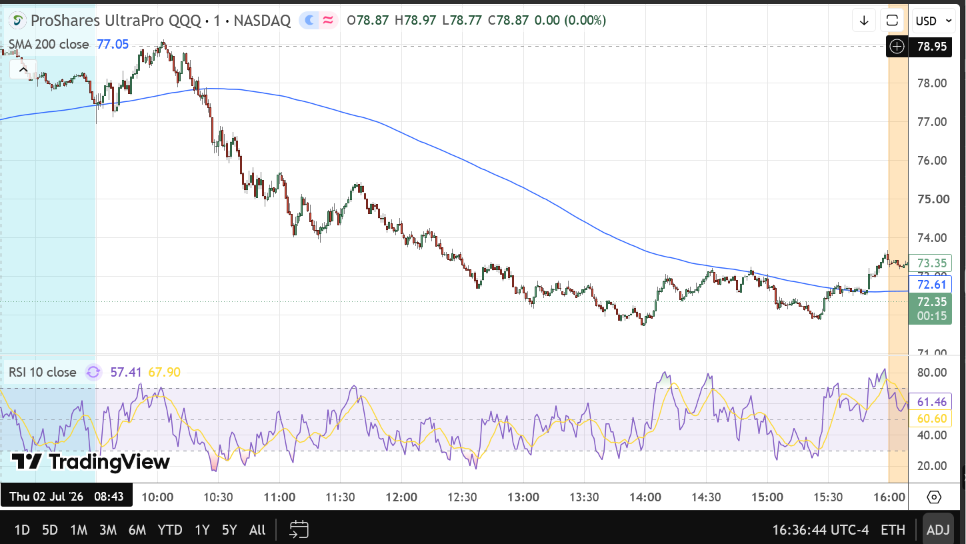
The 1-min chart of the gap down and rip on Friday 17 Jul is interesting to study & remember. The rally did not start right at the open, rather sellers pushed a lot further down first before exhaustion but then the rally was confident.
The range does not get any more clear.
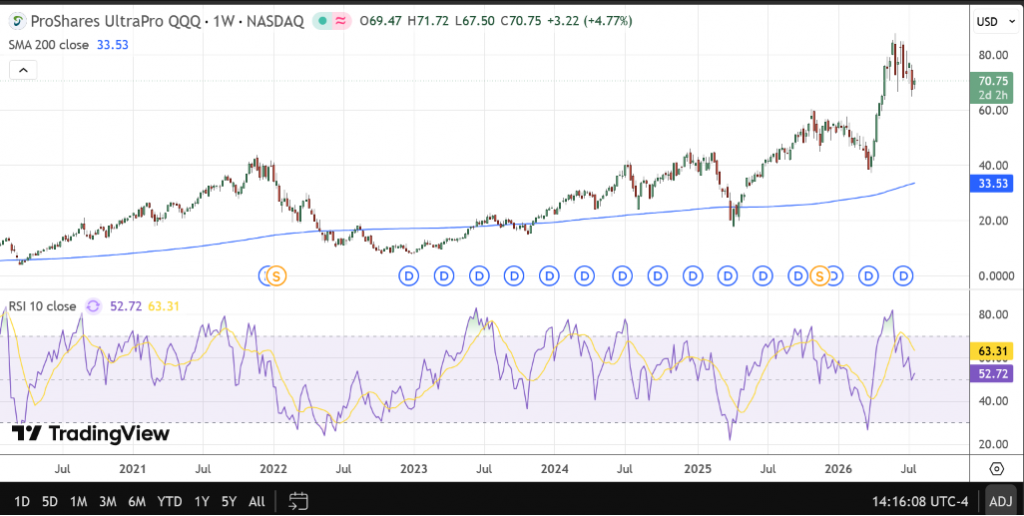
Will the weekly RSI fully reset lower during July-October? That will provide an epic opportunity for a long position.
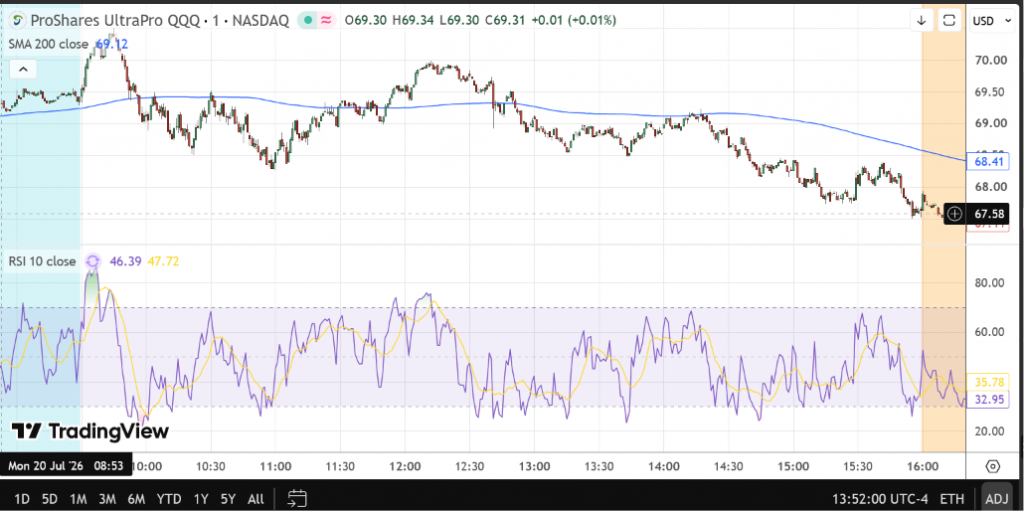
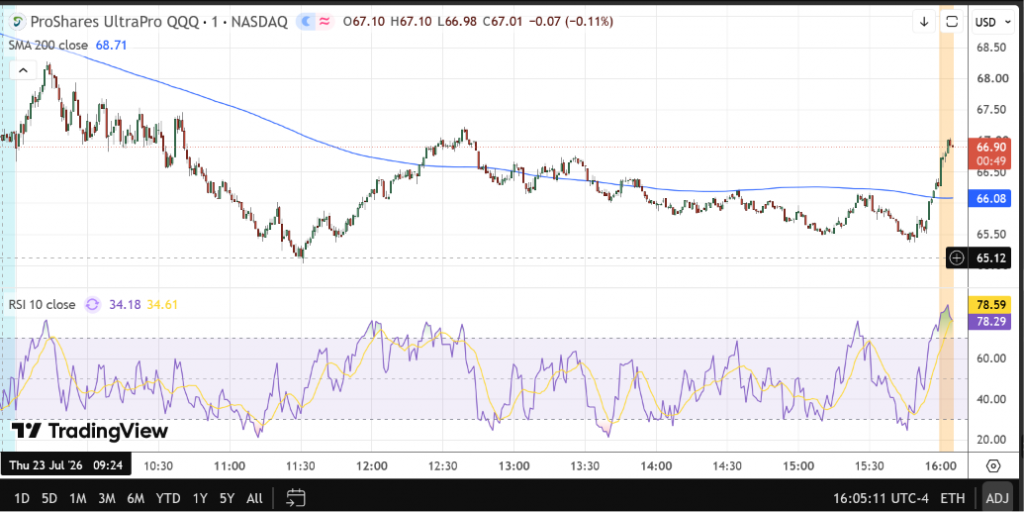
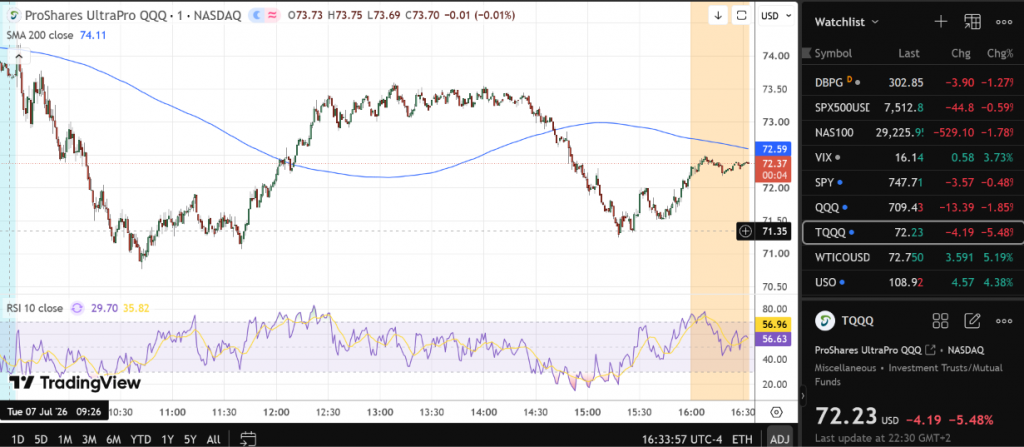
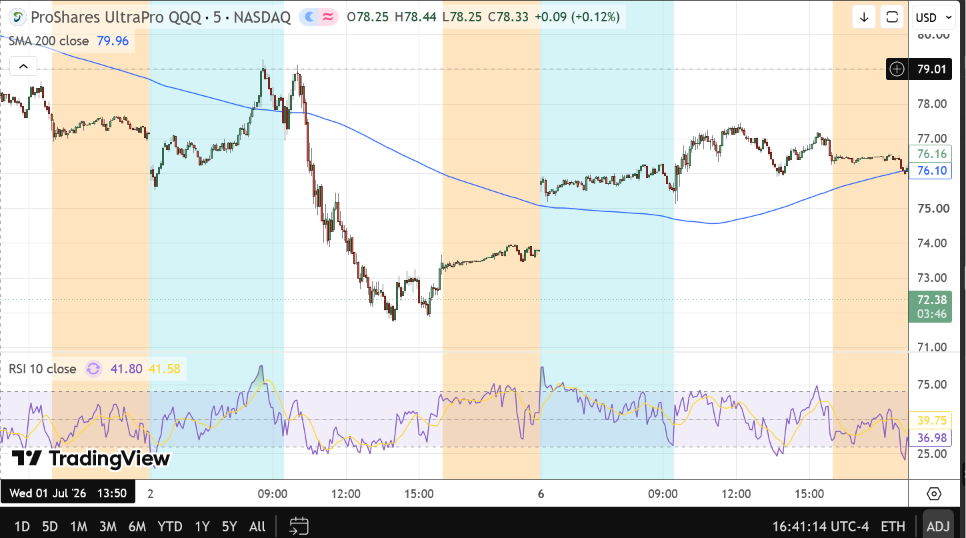
Edit: another gap down, water-boarding until 11.30, some rally, fade again and after hours spike.
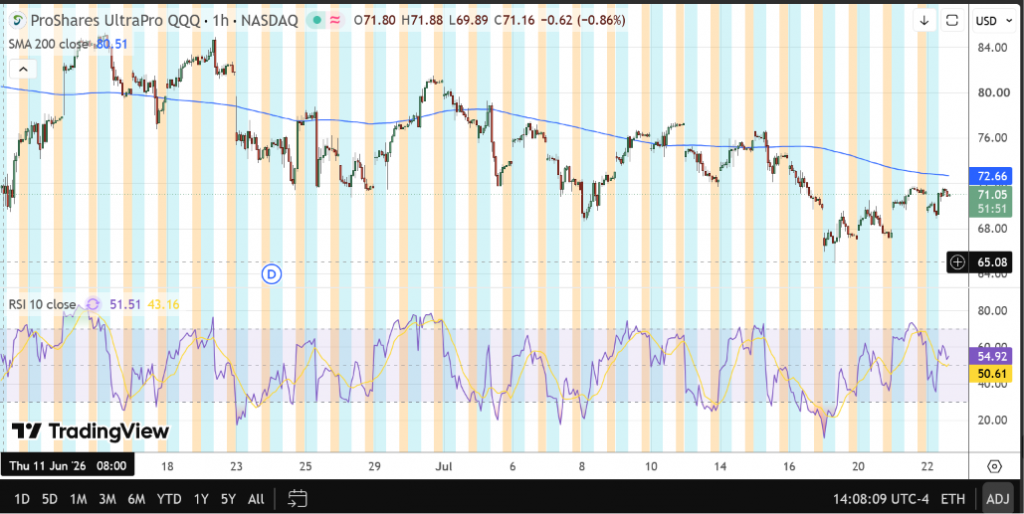
June and beginning of July is having large moves in both directions. Let’s see if July & August will bring in a large drawdown – likely on the back of middle east war.
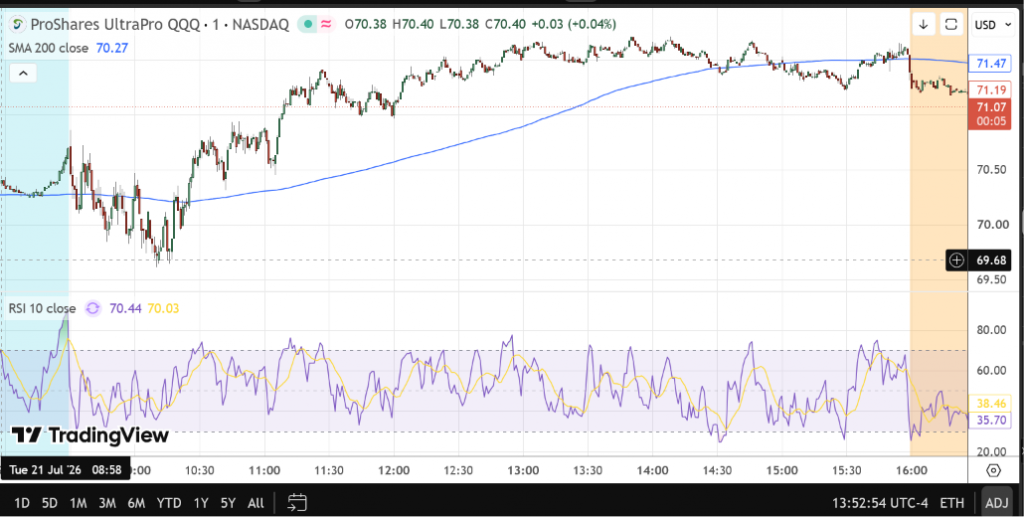
Saving some price action for future reference.
Note the bottom around 10.40am mark, another higher low at 11.40am before a good rally, only to come down again to retest later in the session.
Double top from the pre-market and then elevator down.
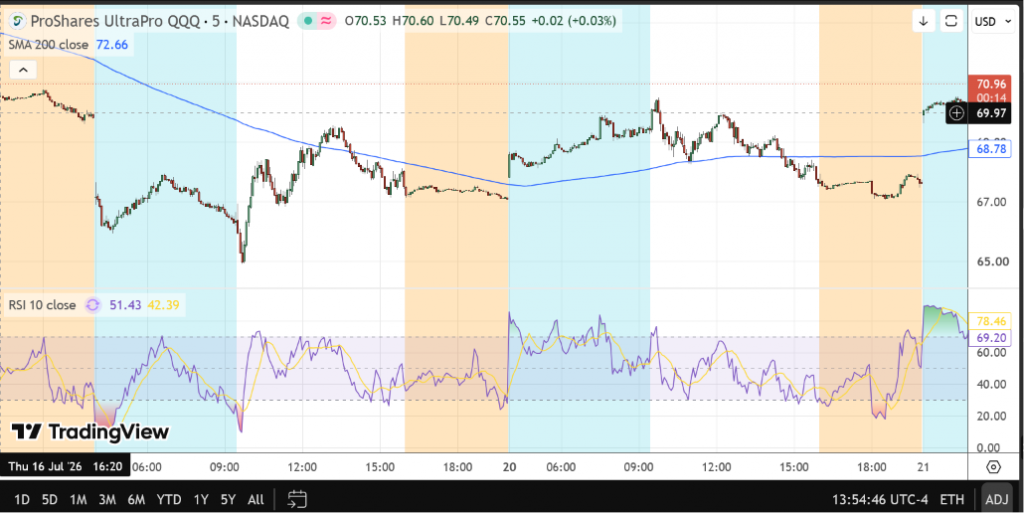
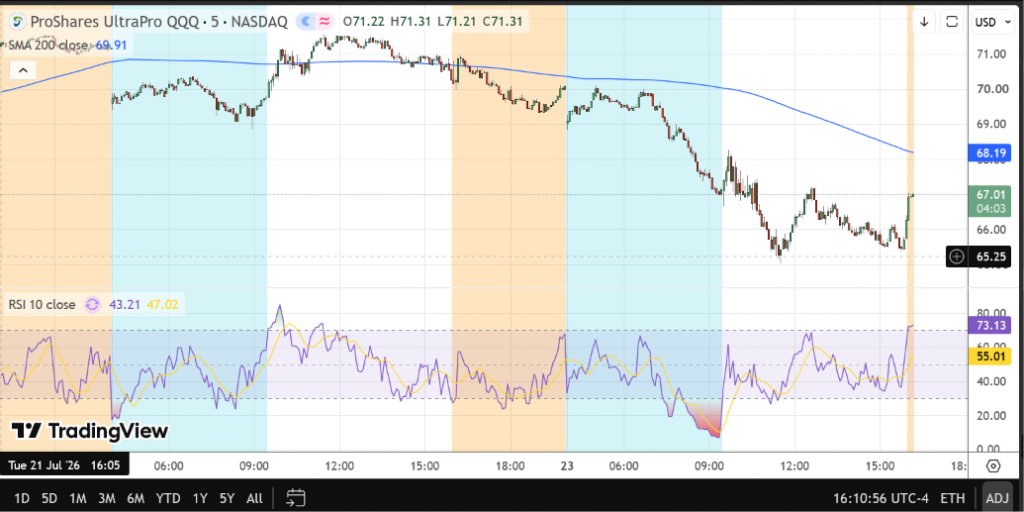
The 5 min chart puts things in better perspective:
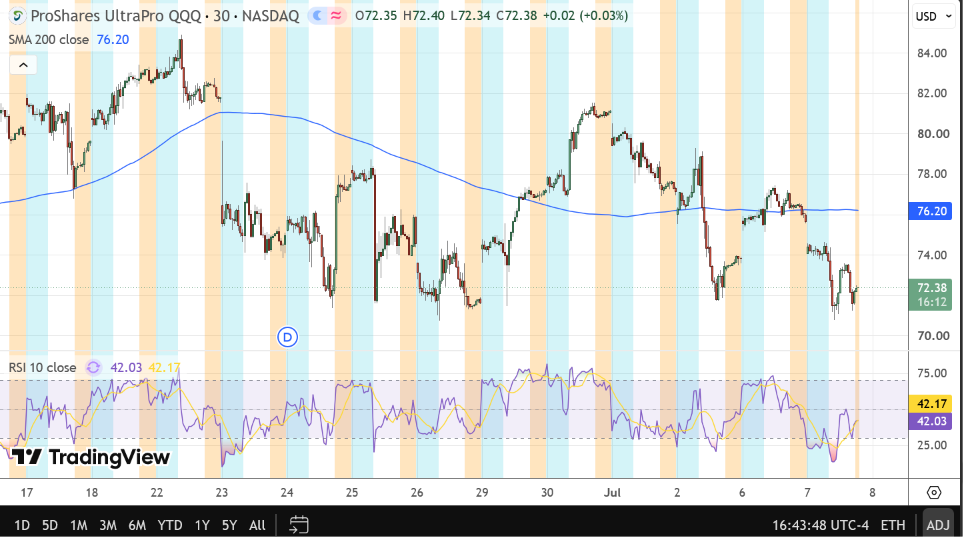
30 min chart, note the lower highs and the base holding so far, could likely crack in July/August, but first another rally perhaps:
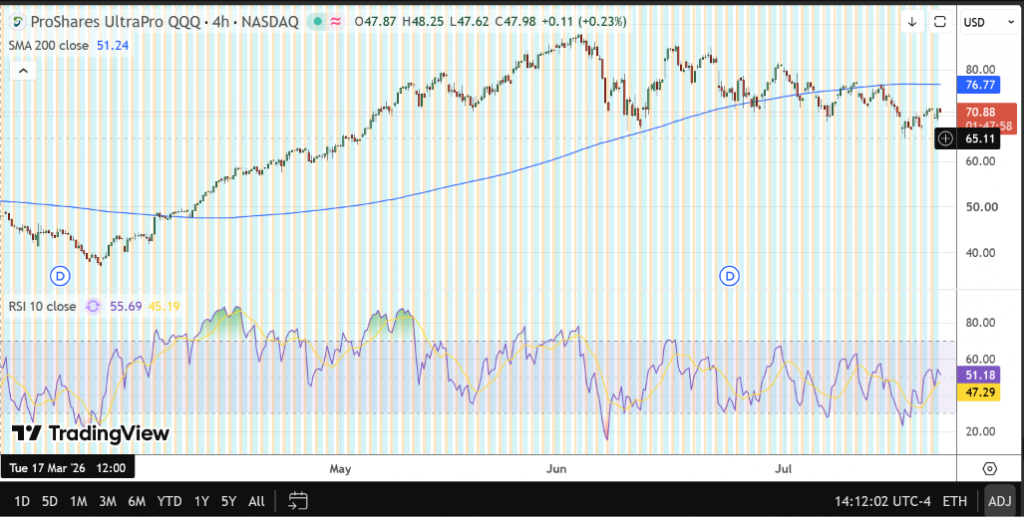
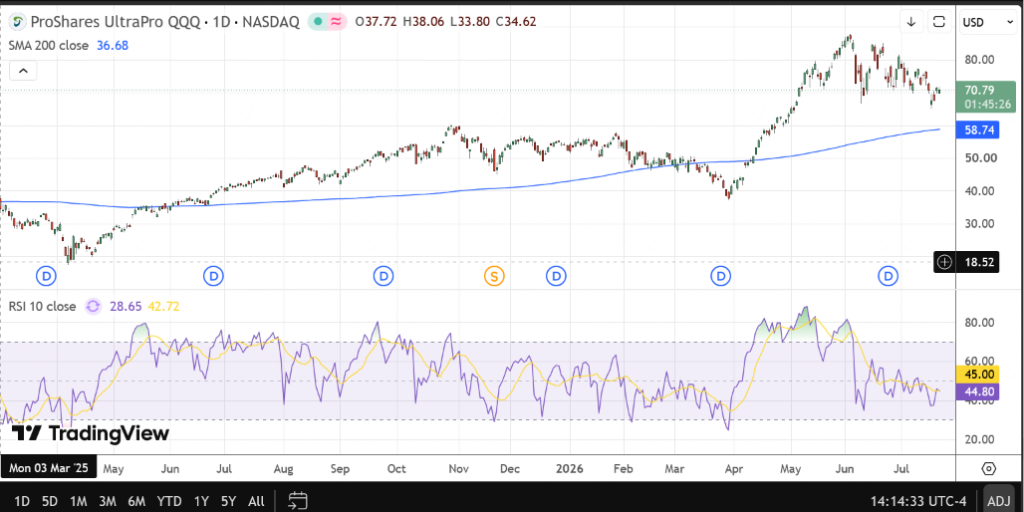
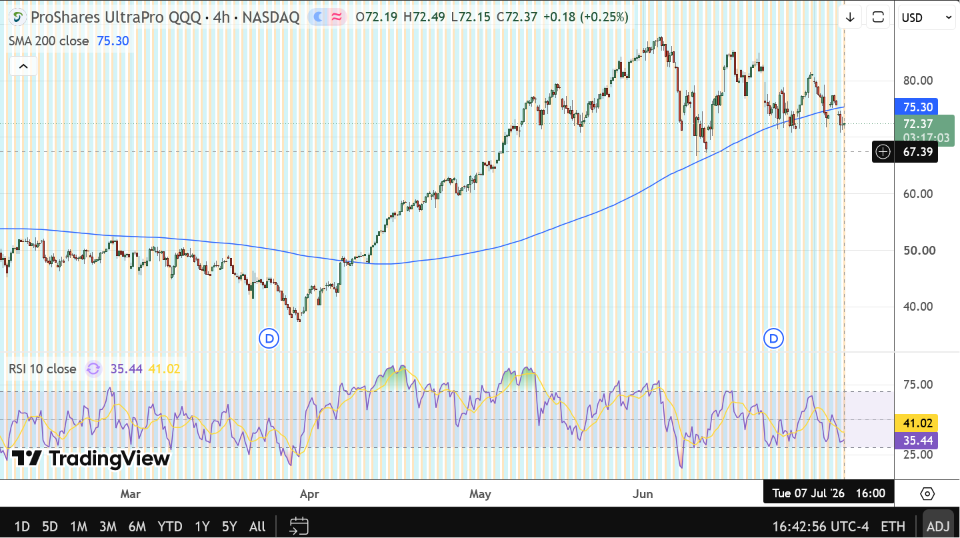
Zooming out on 4h: massive rally since April when Iran war ceasefire came into effect, then top out around 3 June, good size down & up moves since then with lower highs and bottom base.
After a strong rally in S&P500 from April to end of May 2026, June has seen some large moves in both directions, particularly gap ups and gap downs. Moreover, intraday trading range and reversals have been fairly large as well, e.g. 9 June 2026.
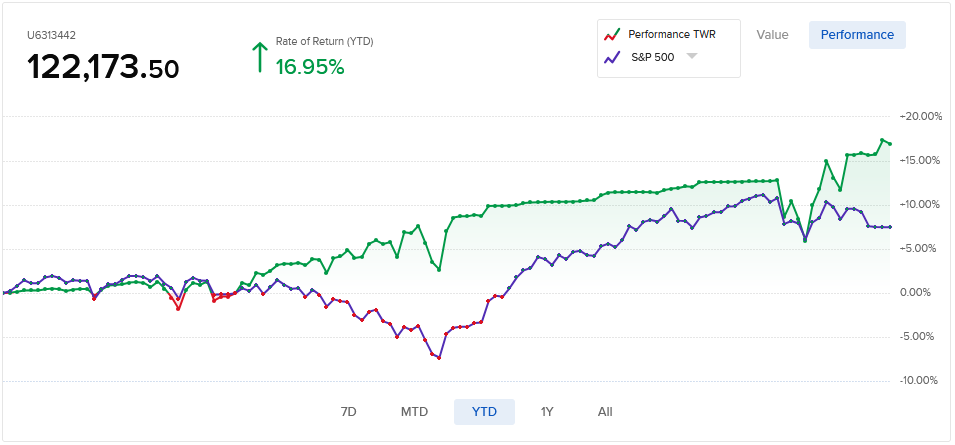
The equity curve of the portfolio I manage has made new highs after a fairly flat period. I’m such a bad trader when markets rally strongly whereas periods of market pullbacks & high volatility generally tend to be more fruitful for me. I really have to get better at riding the market when it does those persistent grind to higher highs.
Anyway, just when the market had caught up to my portfolio gains at the end of May, both went down together (I was in a bit too early as usual), however the choppy market provided some good trading opportunities with a high volatility environment and higher premiums to harvest – which helped propel the portfolio to new highs at +17% YTD gains vs the market which is now at about +7% (26 June 2026). With prudent position sizing, delta selection and near term expiration (1-2 weeks), together with tactical profit taking, I managed not only to avoid recent downdowns but to milk out some gains as well.
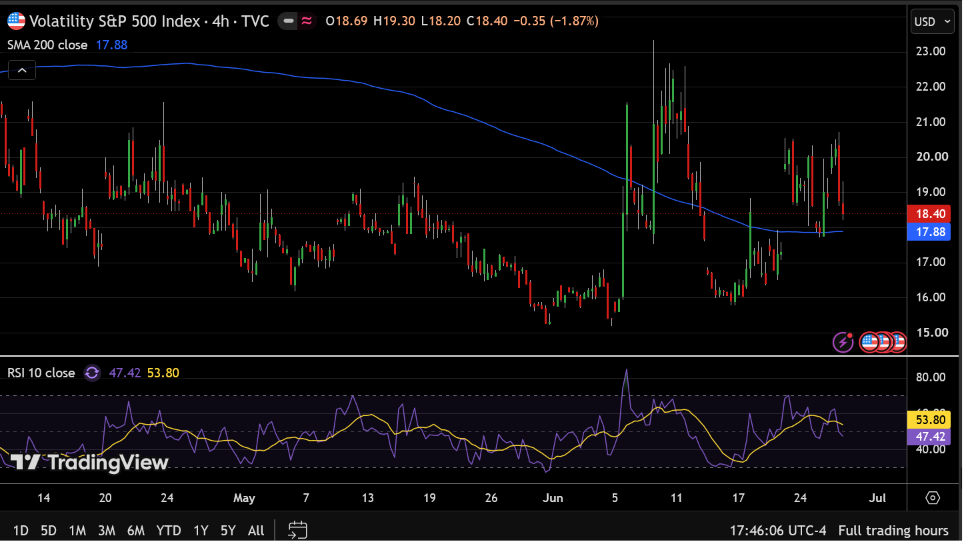
Vix saw some large % moves, from being around the low 16 mark to crossing over 20 in 2 bars of 4hrs! Note the several clusters of spikes in the 2nd spell at around the 20 mark again.
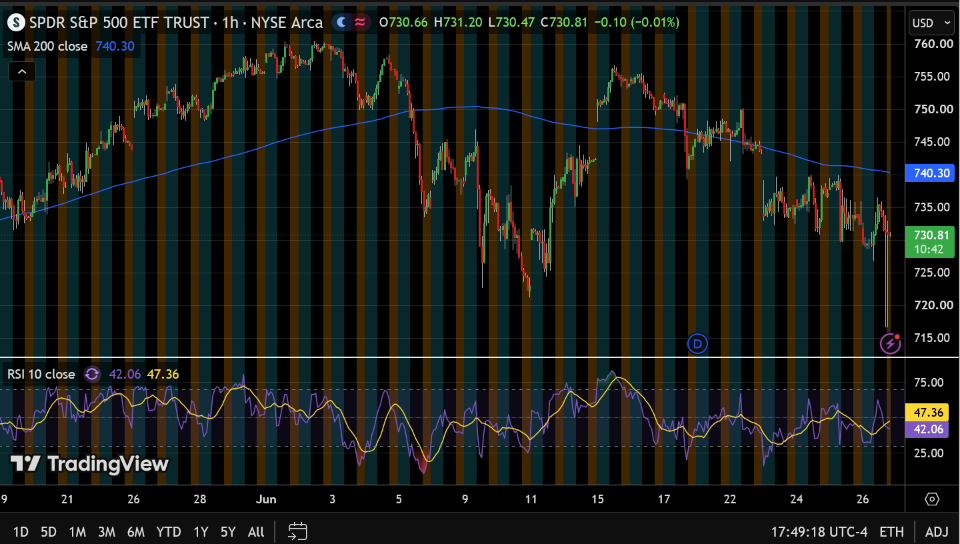
SPY had some sizable gap ups & gaps downs, and now coiling downwards in a diagonal channel/funnel. Does it breakdown to further lows from here? Would be great if it does so! That would set up for a good move higher in July before reversing again in August perhaps, we’ll see.
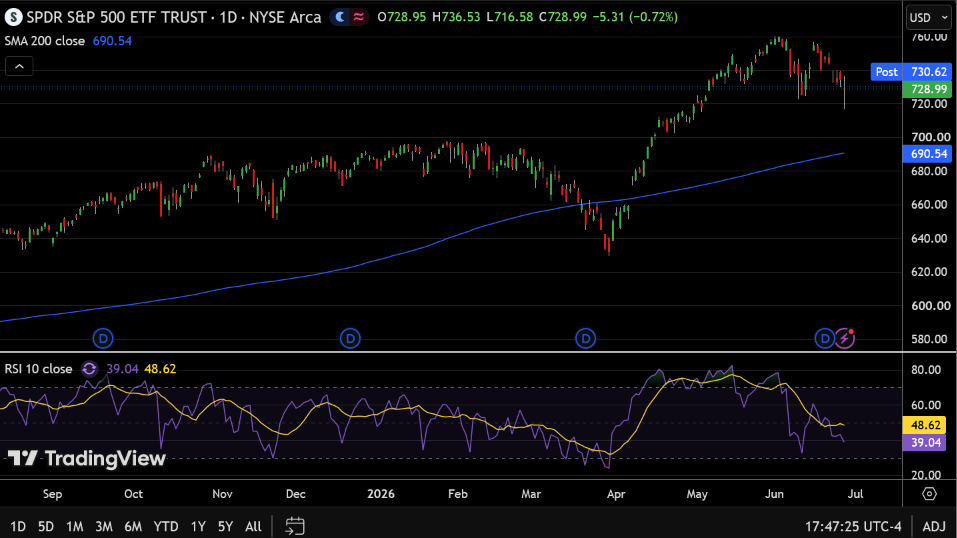
SPY on the daily – again would be great if the market comes down to the previous highs at around the 700 price level – revert to its mean values of 200day SMA. That should set it up for the next leg higher.
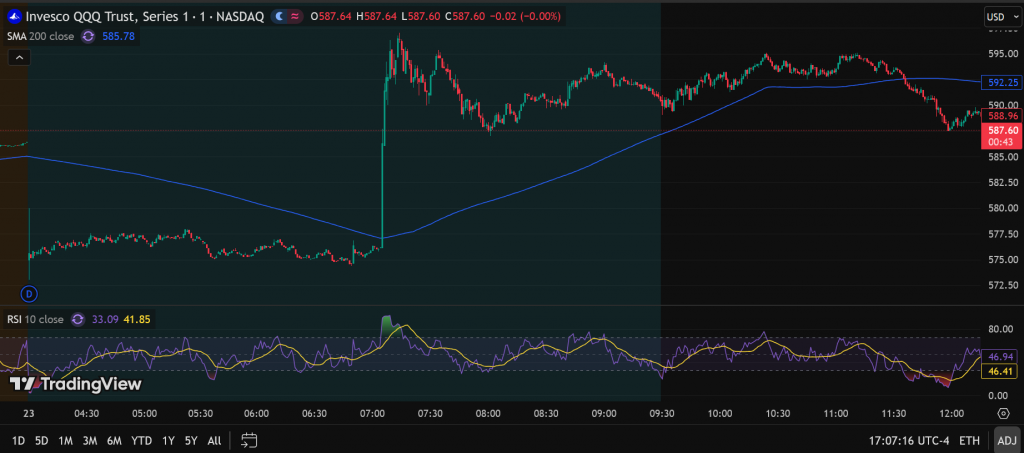
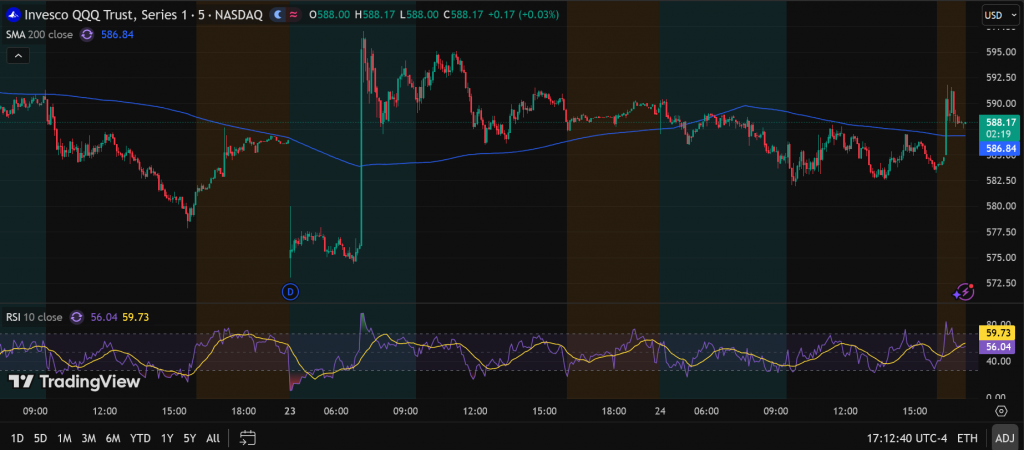
Some social media posts can meaningfully move the markets, especially when the president of USA publishes a potential ceasefire post. Here’s how the Qs (QQQ) moved on a 1 min time-frame, it was about a +3.5% spike. Most of the move materialized in just 5 price bars of 1-min.
Same QQQ chart over a 5min time-frame. Nice flagging pattern (digestion) after a large up move.
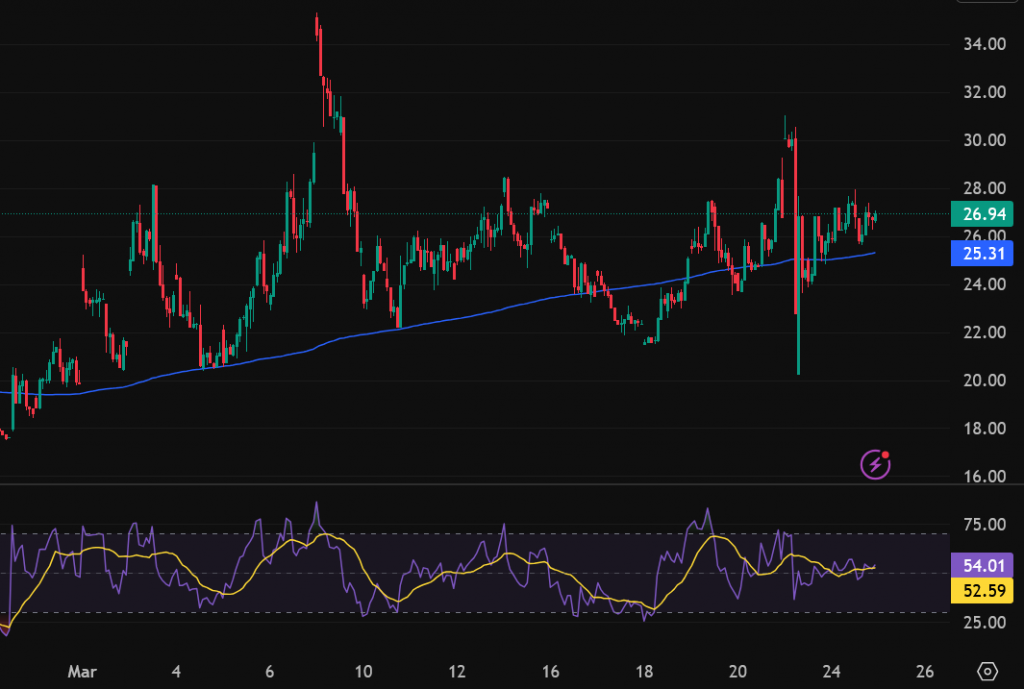
Prior to the ceasefire post, the markets had gapped down overnight with the VIX hitting 30 on its second spike (first major spike on 9 March overnight with a high of 35, chart below). Reacting to the presidential post, VIX made an intraday low of about 20 (a -32% move) before reversing again in search of some equilibrium in this epic madness.
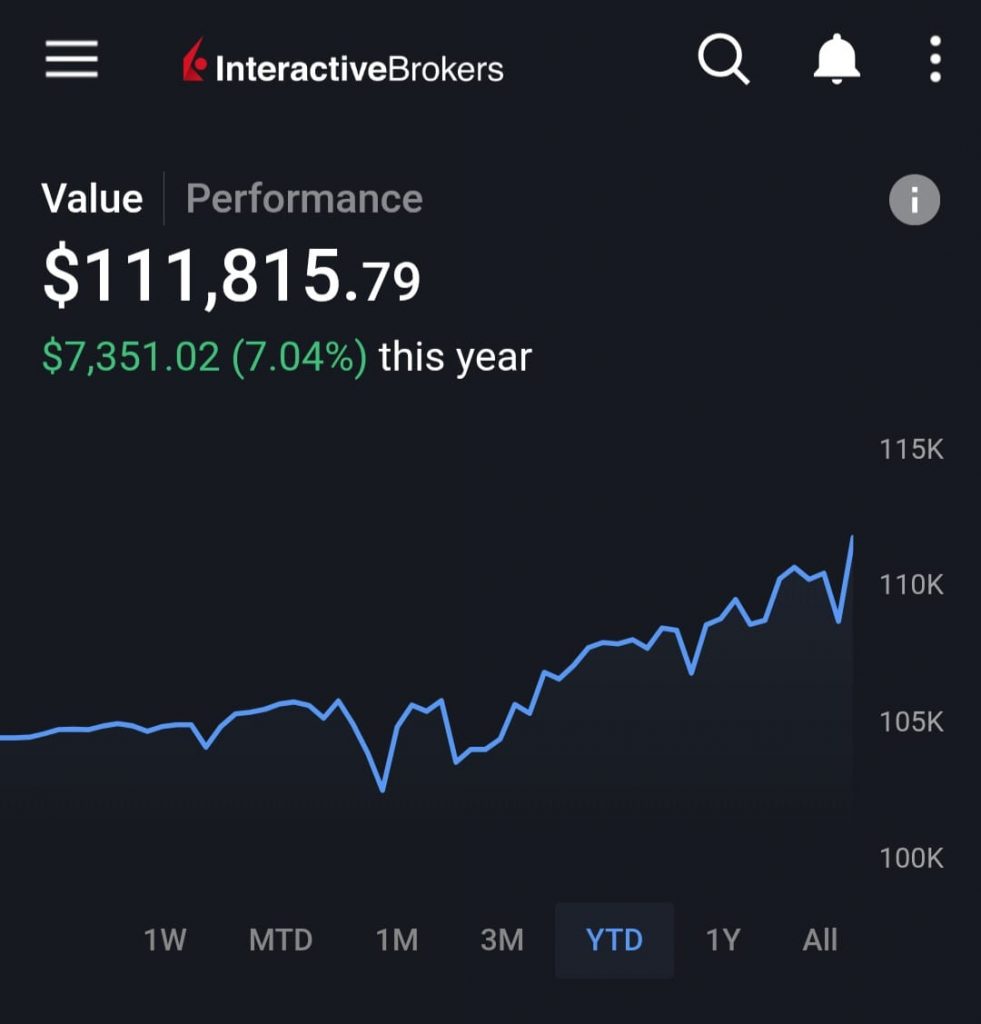
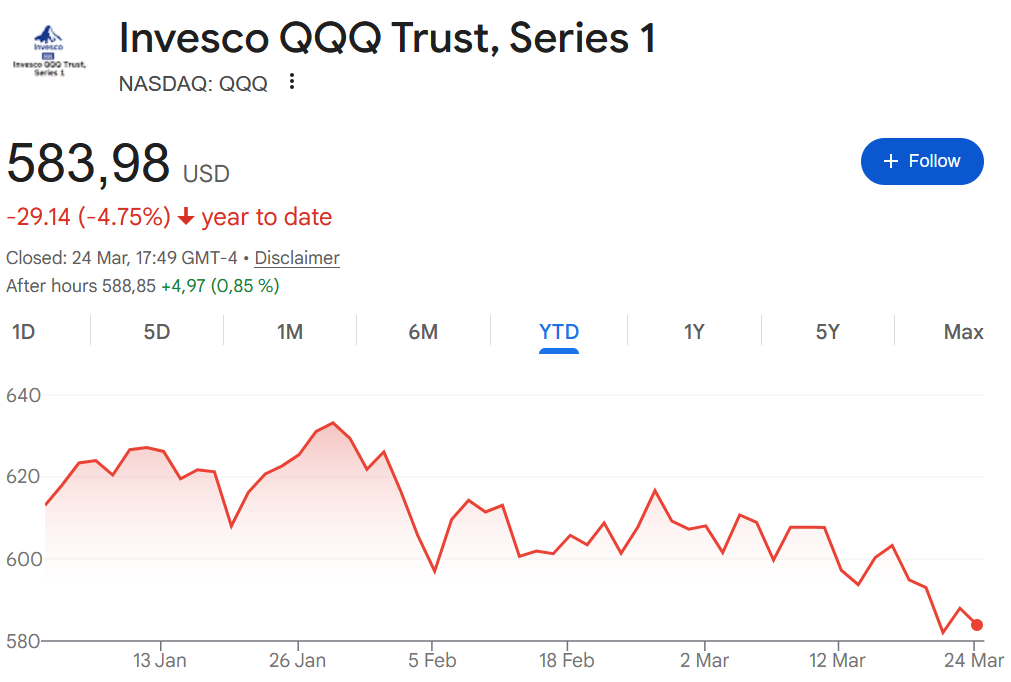
Given this context of market volatility, the portfolio I manage has remained rather resilient, clocking new YTD highs in equity value (up +7% YTD vs -4.8% QQQ).
Why is that so? Some observations:
Small position size of mainly short puts (high IV helps harvesting of fat option premiums), max commitment of about 50% portfolio cash.
Low delta strike selection with weekly or 2 week expirations.
Sold stocks (assigned last Friday) in pre-market after the “ceasefire” news broke out, booking tactical gains. This can be attributed to luck.
Shorting puts on intraday lows and taking profits on up swings (range bound/flagging market). Tiny day trades on TQQQ.